

As shown in the previous 4 posts the foundation for performing and responsive cloud services and applications are healthy relationships! Moreover, these posts gave you detailed and valuable insights on how to recognize and analyze these relationships.
By now you may know that this and the 4 previous posts are also available in one convenient PDF; click here to get your copy.
This was all based on our core best practice as TCP relation therapists for cloud services, applications and networks. To summarize: analyzing and improving these relationships starts with 5 TCP related KPI’s and it’s thresholds. Most of the times, TCP protocols are used as a vehicle to transport data in a reliable and secure manner.
However, from time-to-time we get questions like “What about multimedia applications like VoIP, videoconferencing and those “st(r)eamy” internet games? The majority of these are running over UDP? How does this approach help with these?
Troubleshooting UDP related connectivity and performance issues is relatively easy because by default the problem is with the application and its vendor!
Reason is that UDP is a one-way street with checksums only; no handshakes, no acknowledgements, no sequence numbers, nothing… While this makes things performing and responsive, it comes with a site effect: when not behaving as expected, their respective vendors are responsible for analyzing and fixing things. This is because the error handling is done within the client- and server-side of these services and applications; assuming healthy hosts and healthy networks.
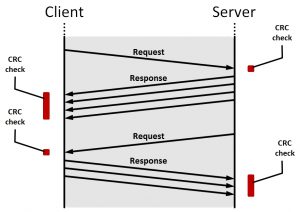
How a typical UDP relationship looks like
It is because of these assumptions that you would need to check if the hosts and networks are indeed healthy. Despite these application and vendor specific algorithms, there are still a few things we can do with our TCP session data approach.
Checking the health of the networks
This is because most companies are using cloud services and applications with both, TCP and UDP types of relationships. As a result, we can still provide visibility in the quality of the network and their different zones. This level of visibility is also important to UDP relationships.
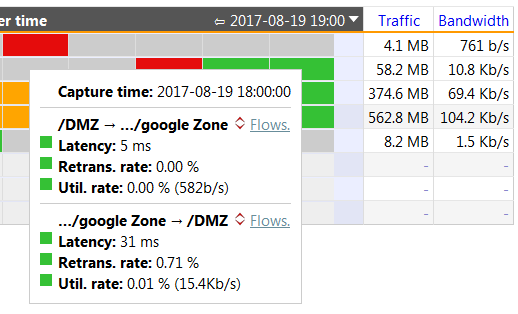
The next figure is about the network zones/segments. What this figure tells you is that around 4 PM, sending data to Google came with an aggregated round trip time of 35 ms and an aggregated re-transmission rate of 4%.
In addition, the utilization rates tells you that there is no reason to believe that the DMZ and its path to the internet were suffering from an overload since these values are all in the green. Even if you do a manual cross-check with the aggregated bandwidth usage, there is no reason to believe that there was an overload.
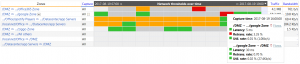
Checking the network health for the different sites/zones
What this figure also tells you is that some time later that afternoon, the situation returned back to healthy since things are back in the green; see also the next figure for more details on this healthy condition.
How to identify if things are back to normal
Meaning the network is healthy (again); what’s left is making sure that the hosts are too.
Checking the health of the hosts
Validating the health of the hosts starts with having visibility on the IP addresses of these hosts. What the list in the next figure tells you is that there were several users working with the Google apps; either TCP or UDP based.
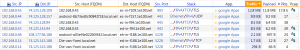
Analyzing the health of the relationships for specific end-user devices
The next step is figuring out if either of these devices where suffering from a system overload. To do that, we extend the previous view with the relevant TCP information since UDP doesn’t provide this level of detail.
This list tells you that there is no system overload (and only a few dropped messages). This is because both “0-Win”-columns show all zeros (while some parts of the “DupAck”-columns do not).
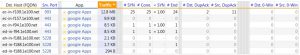
Strong indicators for hosts with a system overload
Conclusion: even when cloud services and applications are using UDP, this TCP session data approach allows you to support the teams with troubleshooting connectivity and performance issues in the same consistent manner.
Where to go from here
The previous 5 posts showed you that the complexity on analyzing and troubleshooting the performance of cloud services and applications can be simplified significantly. This is because the required amount of TCP session data is limited and is presented in an easy-to-understand format.
The result is a consistent workflow with a quick and predictable outcome; even when applied to 2 or more applications simultaneously.
Best of all, this approach works for all types of cloud services, any type of business application, encrypted (or not). Moreover, this approach is 100% save because all TCP session data is collected in a passive, non-intrusive manner. Meaning the integrity of your data is guaranteed; no worries about man-in-the-middle breaches or privately owned certificates “lying around” with external parties.
Feel free to call us or send us an e-mail you have any questions on all this. Alternatively, use the contact form on the right to leave a message.
Perhaps even better: allow yourself some hands-on and try it in your own environment; free of charge and no strings attached! Because like many other organizations, most likely, your organization is also running a migration program of some sort:
- a migration to Office635 with Exchange- and Sharepoint-online
- a datacenter consolidation that includes a clean, fresh start with the next Citrix/SAP combo
- a new Android and iOS app running in parellel of your regular e-commerce website
All 5 posts are still available in one convenient PDF; click here to get your copy.